This post is part of the series on performance monitoring with Intel MSRs on Linux:
- A Linux Module For Reading/Writing MSRs
- Intel MSR Performance Monitoring Basics
- Fun with MSRs: Counting Performance Events On Intel
- Scripting MSR Performance Tests With kdb+: this post
- Scripting MSR Performance Tests With kdb+: Part 2
- Intel Performance Monitoring: Loose Ends
One of the issues with coding performance monitoring code is the management of the PMC/FFC configuration scripts. As you can see from my previous posts (1, 2, 3), using the scripts with the MSR kernel driver is easy, but getting the right data into the script in the first place is a bit more tricky. You could certainly provide helper functions in order to facilitate the twiddling of the various bits in the IA32_PERFEVTSELx registers. However, to make it useable I think it should be possible to look up the different performance monitoring events by name.
I tried out a few different ways of doing this before coming up with the idea that a scriptable, in-memory database would be idea for the purpose, since while it could not only store the configuration to to allow the by-name look-up of performance events, it could also store the results and allow these to be queried (or averaged, counted or otherwise aggregated). My choice of database technology here is kdb+, a vector-oriented database. The binary is less than 300 Kb.
kdb+ is a good fit in this case not only because of its size and extendability through native shared libraries, but also because of its interactive console and powerful query language q (and its predecessor, k). Kx Systems also make available a trial version of the software, so it should be possible to download the Linux version and play along. ~It’s too bad that there’s only a 32-bit version available to play with, which if you have a 64-bit distribution installed just plain won’t work unless you can persuade it to link with 32-bit C-standard shared libraries. Come on Kx: move with the times! 32-bit is like soooo last millenium…~ Happily, there is now a 64-bit non-commercial download available.
Anyway, moving on… there will be a few steps to making this work, so this is going to get more involved than the previous posts (links above), as this solution needs the following:
- A config file containing the performance event monitoring data from the Intel manuals — and the means to read it;
- A shared library capable of being dynamically-linked to kdb+ which can return test results in a native kdb+ table;
- A few kdb+ functions make make the configuration of test runs more easy.
Performance Event Monitoring Configuration Data
Fortunately, kdb+ has built-in functions to read CSV files, so it was just getting the data out of the Intel Manual into the CSV was the hard part. My question on the (actively-moderated) Intel Performance Monitoring forum regarding whether this information is published in a computer-readable format (i.e. not PDF) got its first reply yesterday; the suggestion was to download VTune and have a look in the bin32 directory. That may have helped, but by then I’d tried tools like pdftotext and pdftohtml and found them not to be much help because PDFs don’t have the concept of tables or table-cells, merely text-positioning and line-drawing meta-data.
Fortunately, though, the full version of Adobe Acrobat (not the Reader) has the option to “Copy as table”, which can be pasted into Excel. Discovering this made the job of getting the data out of the tables (Vol. 3B, table 19-6) possible. I should probably say that I’ve only been through this process for the Sandy Bridge CPU family, since that’s what I’m running. The data, when cleaned-up, looks a bit like this:
03, 01, LD_BLOCKS.DATA_UNKNOWN,"blocked loads due to store buffer blocks with unknown data."
03, 02, LD_BLOCKS.STORE_FORWARD,"loads blocked by overlapping with store buffer that cannot be forwarded ."
03, 08, LD_BLOCKS.NO_SR,"# of Split loads blocked due to resource not available."
03, 10, LD_BLOCKS.ALL_BLOCK,"Number of cases where any load is blocked but has no DCU miss."
05, 01, MISALIGN_MEM_REF.LOADS,"Speculative cache-line split load uops dispatched to L1D."
The columns are not declared in the CSV file but are named and typed in the q script which loads it. The columns are as follows: Event Number, UMask, Event Mask Mnemonic, Description. I’ve elided the “Comment” column present in the manuals and added any text in that field to the description.
A quick dissection of a line of q
With apologies to the Gods of kdb+ who happen to read this blog, loading the CSV file in q is, like everything else, very terse:
data:flip `event`umask`mnemonic`description!("XXS*";",") 0:`:pmcdata.csvTo give non-kdb folk an insight into the q language, I’ll try to give you some idea about what’s going on:
("XXS*";",") 0:`:pmcdata.csv
This loads the CSV file pmcdata.csv from the current directory, and passes as arguments to the 0: load function the column-definition of byte, byte, symbol and generic list ("XXS*") and separator-value ",". The result is a list of typed-vectors.
`event`umask`mnemonic`description!_list-of-typed-vectors_The ! operator converts the list argument on the right to be the values in a dictionary whose keys are the symbol-vector on the left: event, umask, mnemonic and description. Finally, we have:
data:flip _dictionary_The flip command converts a dictionary (having a rectangular shape and some other formailities) into what we think of as a table. The result of the flip command is assigned to the variable data. It’s a powerful language but really does take some getting used to.
It’s possible to build up functions which can add value to the data now loaded. For example, to retrieve the values by mnemonic, the following select statement does the trick:
select event, umask from data where mnemonic = `UOPS_ISSUED.ANYWith the following, entirely expected results:
event umask
-----------
0e    01
UMask Combining
It’s at this point that I’d like to touch on another not necessarily obvious aspect of the Intel PMC event framework: you can arrange for the PMCs to count more than one thing at once. If you’ve had a good long look at the Intel Performance Event tables in Vol. 3B, Ch. 19, you’ll have seen that there are multiple entries per Event Number, each with a different UMask value. Confused? How about an example? Here are the entries for event 0x24 which counts different aspects of the Level-2 cache requests:
event umask mnemonic                    description
---------------------------------------------------------------------------------------------------------
24    01    L2_RQSTS.DEMAND_DATA_RD_HIT "Demand Data Read requests that hit L2 cache."
24    03    L2_RQSTS.ALL_DEMAND_DATA_RD "Counts any demand and L1 HW prefetch data load requests to L2."
24    04    L2_RQSTS.RFO_HITS           "Counts the number of store RFO requests that hit the L2 cache."
24    08    L2_RQSTS.RFO_MISS           "Counts the number of store RFO requests that miss the L2 cache."
24    0c    L2_RQSTS.ALL_RFO            "Counts all L2 store RFO requests."
24    10    L2_RQSTS.CODE_RD_HIT        "Number of instruction fetches that hit the L2 cache."
24    20    L2_RQSTS.CODE_RD_MISS       "Number of instruction fetches that missed the L2 cache."
24    30    L2_RQSTS.ALL_CODE_RD        "Counts all L2 code requests."
24    40    L2_RQSTS.PF_HIT             "Requests from L2 Hardware prefetcher that hit L2."
24    80    L2_RQSTS.PF_MISS            "Requests from L2 Hardware prefetcher that missed L2."
24    c0    L2_RQSTS.ALL_PF             "Any requests from L2 Hardware prefetchers."
Notice anything about the values in the umask column? The UMask values are bit-masks. The event L2_RQSTS.ALL_RFO (umask 0x0c == 0x08 + 0x04) counts both L2_RQSTS.RFO_MISS (0x08) and L2_RQSTS.RFO_HITS (0x04). However, this is simply an explicit aggregation noted by Intel in the manual, and unless the description instructs otherwise, you can usually combine events with the same event number. So to count L2_RQSTS.RFO_HITS (0x04) and L2_RQSTS.CODE_RD_HIT (0x10) we would use a umask value of 0x14. A useful one to note here (courtesy of Agner Fog’s testp library) could be called “Level-1 cache misses”, which is all Level-2 cache requests: L2_RQSTS.ALL_DEMAND_DATA_RD + L2_RQSTS.ALL_RFO = umask 0x0F.
From Intel mnemonics to WRMSR.eax value
So can we do something useful in q to do this for us? Why, yes, we can:
select `int$+/[umask] by event from data where mnemonic in `L2_RQSTS.ALL_DEMAND_DATA_RD`L2_RQSTS.ALL_RFOThis uses the over function modifier (the forward slash) with + to accumulate the umask values. Note that the umask value is cast to an int and in the result below is decimal 15 (hex 0x0F) and hence the expected result:
event| umask
-----| -----
24   | 15
We can refine this further to produce the base value to be written to the MsrInOut.eax field:
tmp:select `int$+/[umask] by event from .pmc.evt where mnemonic in `L2_RQSTS.ALL_DEMAND_DATA_RD`L2_RQSTS.ALL_RFO;
first exec event + 256i * umask from tmp;
The result in this case is 3876, which is the hex value 0x0F24 — the expected result. If we now set the individual flags and CMask value we’re almost there. Here’s how we’ll look-up the values for the individual PMC flags:
flags:([]name:`inv`en`any`int`pc`edg`os`usr;val:{`int$ 2 xexp x}[23 22 21 20 19 18 17 16i])
The above command constructs a table containing the powers of two corresponding to each flag. In the following output, I’ve manually added the hex value corresponding to the decimal output to make things clearer:
name val
------------
inv  8388608   / 0x800000
en   4194304   / 0x400000
any  2097152   / 0x200000
int  1048576   / 0x100000
pc    524288   / 0x080000
edg   262144   / 0x040000
os    131072   / 0x020000
usr    65536   / 0x010000
Of course, given a table of values such as the above, it’s trivial to look up and accumulate the value for a set of flags:
+/[exec val from flags where name in `en`usr]The above instruction yields the decimal result 4259840 which is the hex value 0x410000. If we went through the process of adding a CMask value (promoted << 24 bits) we’d have the value required to write into MsrInOut.eax. I’m not going to go through the CMask step since it’s just not that hard.
Anyway… I’m not going to discuss every aspect of the complete script since unless you already know q it’s probably not going to help much. The script below basically does the following:
- Converts a list of logical event descriptors into a list of
MsrInOut.eaxvalues to write to theIA32_PERFEVTSELxMSRs (.pmc.runscript) - Builds a dictionary of
MsrInOutvalues containing the above PMC values as well as FFC config and global control values (.pmc.runtest) - Pass control to the shared library to build the in-memory
MsrInOutcommand arrays and execute the test - Build the result table from the results generated by the shared-library.
This is all probably getting a bit turgid, so without further ado, here’s a brief workflow of how the processing is done inside kdb+:
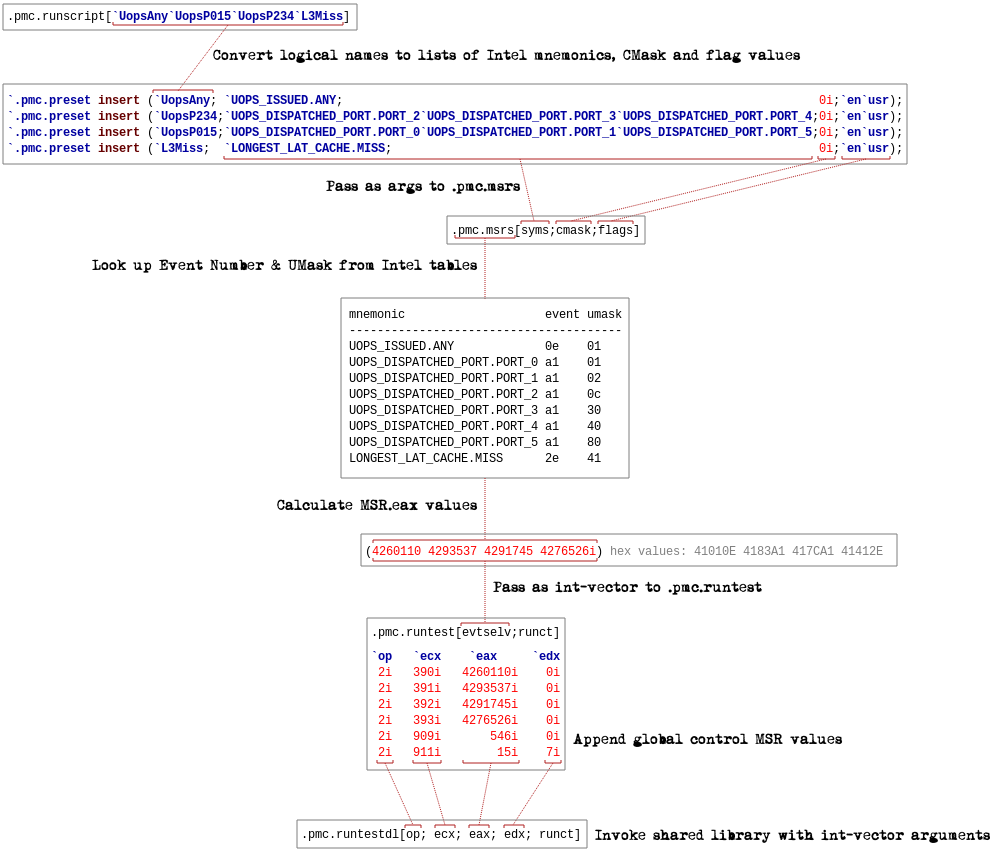
Here’s the controller script (carefully commented, so do try to read!):
pmc.q
/-- load the shared library 'libpmc.so' and assign the 5-arg function 'runtest' to .pmc.runtestdl
.pmc.runtestdl:`libpmc 2:(`runtest;5);
/-- load the CSV
.pmc.evt:flip `event`umask`mnemonic`description!("XXS*";",") 0:`:pmcdata.csv
/-- initialise the table of absolute flag values
.pmc.flags:([]name:`inv`en`any`int`pc`edg`os`usr;val:{`int$ 2 xexp x}[23 22 21 20 19 18 17 16i])

/-- table will contain a set of event combinations accessible through a logical name
.pmc.preset:([]name:`$();syms:();cmask:`int$();flags:());
/-- insert a row containing sym-vectors first
`.pmc.preset insert (`UopsP234;`UOPS_DISPATCHED_PORT.PORT_2`UOPS_DISPATCHED_PORT.PORT_3`UOPS_DISPATCHED_PORT.PORT_4;0i;`en`usr);
`.pmc.preset insert (`UopsP015;`UOPS_DISPATCHED_PORT.PORT_0`UOPS_DISPATCHED_PORT.PORT_1`UOPS_DISPATCHED_PORT.PORT_5;0i;`en`usr);
`.pmc.preset insert (`UopsP0;`UOPS_DISPATCHED_PORT.PORT_0;0i;`en`usr);
`.pmc.preset insert (`UopsP1;`UOPS_DISPATCHED_PORT.PORT_1;0i;`en`usr);
`.pmc.preset insert (`UopsP5;`UOPS_DISPATCHED_PORT.PORT_5;0i;`en`usr); /-- Agner says unreliable PMCTestA.cpp,l.850
`.pmc.preset insert (`UopsAny;`UOPS_ISSUED.ANY;0i;`en`usr);
`.pmc.preset insert (`L1Miss;`L2_RQSTS.ALL_DEMAND_DATA_RD`L2_RQSTS.ALL_RFO;0i;`en`usr);
`.pmc.preset insert (`L3Miss;`LONGEST_LAT_CACHE.MISS;0i;`en`usr);
`.pmc.preset insert (`BrMispred;`BR_MISP_RETIRED.ALL_BRANCHES;0i;`en`usr);

/
-- This function operates on vectors of typed-data, and can be used in a select statement:
-- select .pmc.msrs[col1;col2;col3] from tbl
-- Args:
-- - mnms: a list of symbol-vectors (.pmc.evt mnemonics)
-- - cmsk: a list of int-vectors
-- - flags: a list of symbol-vectors (corresponding to the values in .pmc.flags)
\
.pmc.msrs:{[mnms;cmsk;flags]
    msr:{first exec event + 256i * umask from select `int$+/[umask] by event from .pmc.evt where mnemonic in x} each mnms;
    msr+:{16777216i * x} each cmsk;
    msr+:{+/[exec val from .pmc.flags where name in x]} each flags;
    :msr
 };

/
-- Takes a symbol vector of logical names in the .pmc.preset table, from which it generates the MSR.eax
-- values required for the general PMCs. It passes these to .pmc.runtest for execution, and aggregtes
-- the results.
\
.pmc.runscript:{[symvec]
    kv:raze {exec name!.pmc.msrs[syms;cmask;flags] from .pmc.preset where name=x} each symvec;
    result:.pmc.runtest[value kv;32];
    t:flip (`instAny`clkCore`clkRef,key kv)!result;
    t:update mHz:`int$ 2700 % clkRef % clkCore from t;
    :t
 };

/
-- Generates a table of values capable of being transcribed into the struct MsrInOut[], and passes
-- those values to the shared library.
-- Args:
-- - evtselv: vector of MSR.eax values
-- - runct: the number of test iterations to carry out
\
.pmc.runtest:{[evtselv;runct]
    i:0i;
 /-- object in which to store MSR values
    msrd:`op`ecx`eax`edx!(`int$();`int$();`int$();`int$());
 /-- acculator for enabling individual PMCs
    ctren:0i;
 /-- iterate over perf event select int values
    while [ i < count evtselv;
 /-- append values
        msrd[`op],:2;           /-- MSR_WRITE
        msrd[`ecx],:390i+i;     /-- 0x186+i (ia32_perfevtselx)
        msrd[`eax],:evtselv[i]; /-- MSR.eax value calc'd earlier
        msrd[`edx],:0i;
        ctren+:`int$2 xexp i;   /-- accumulate perf_global_ctrl.eax value
        i+:1i];
 /-- perf_fixed_ctr_ctrl - 0x222 enables all three
    msrd[`op],:2;      /-- MSR_WRITE
    msrd[`ecx],:909i;  /-- 0x38d
    msrd[`eax],:546i;  /-- 0x222
    msrd[`edx],:0i;
 /-- perf_global_ctrl
    msrd[`op],:2;      /-- MSR_WRITE
    msrd[`ecx],:911i;  /-- 0x38f
    msrd[`eax],:ctren; /-- PMC-enable value
    msrd[`edx],:7i;    /-- enable FFCs
 /-- Execute test through the shared library
    result:.pmc.runtestdl[msrd`op; msrd`ecx; msrd`eax; msrd`edx; runct];
 /-- Explictly return result
    :result
 };

/-- canned script to execute the test with each of `UopsAny`UopsP015`UopsP234`L3Miss
.pmc.script1:{
    .pmc.runscript[`UopsAny`UopsP015`UopsP234`L3Miss]
 };
/-- canned script to execute the test with each of `L1Miss`L3Miss`BrMispred`UopsAny
.pmc.script2:{
    .pmc.runscript[`L1Miss`L3Miss`BrMispred`UopsAny]
 };