This post is part of the series on performance monitoring with Intel MSRs on Linux:
- A Linux Module For Reading/Writing MSRs
- Intel MSR Performance Monitoring Basics: this post
- Fun with MSRs: Counting Performance Events On Intel
- Scripting MSR Performance Tests With kdb+
- Scripting MSR Performance Tests With kdb+: Part 2
- Intel Performance Monitoring: Loose Ends
In the previous post I published code to create, build and install a Linux kernel module which would permit a user to execute a batch of commands to read from or write to Intel MSRs. This post will provide some background on using MSRs and controlling their behaviour. Throughout the following discussion, I’m going to discuss the 2nd Generation Core i7 processor family, since that is what I’m using.
Architectural Performance Monitoring
For a couple of processor generations (introduced with the Core 2 Solo and Core 2 Duo CPUs), Intel CPUs have supported what they call “Architectural Performance Monitoring”, that is, the performance events are consistent across microarchitectures. The set of monitoring events supported by a CPU can be checked using the CPUID instruction (with 0x0A as its EAX parameter). Unfortunately it doesn’t look to me as though this information can be cleaned from /proc/cpuinfo or even the Ubuntu-optional cpuid application (although you could decipher its hexdump if you wanted). Fortunately, it’s a doddle to read:
#include <stdio.h>

int main(void)
{
    unsigned eax;
    __asm__ __volatile__("cpuid" : "=a"(eax) : "a"(0x0a));
    printf("Perf Mon Version: %d\\n", (0xFF & eax));
    return 0;
}
On my Core i7-2620M I get the following:
$ gcc cpu_pmc_ver.c
$ ./a.out
Perf Mon Version: 3
$
This is all still quite formal, though; when you get down to it, at least, on a 2nd gen Core-i7, you find that you have three fixed-function counters in total and four general-purpose counters (per hardware thread). You can find out this and more information by consulting the output of the CPUID instruction again — and there’s the source to do it here. I don’t like linking to off-site resources since they so often move or get lost, but it’s my Github repo, so unless we lose Github the link should work ;) If you check out that file’s directory you’ll also get a Makefile to build it.
The leaf0ah app prints the following output for me:
VersionID [7:0]:    3
#GP regs/lcore:     4
GP-PMC bit-width:  48
EBX bit-vec len:    7
Core cycle evt:   yes
Instr retd evt:   yes
Ref cycles evt:   yes
LLC ref evt:      yes
LLC misses evt:   yes
Branch:
 instr retd evt:  yes
 misprd retd evt: yes
#fixed fn PMC:      3
FF bit-width:      48
This confirms that there are four programmable counters (per logical core) and three fixed counters which count only one type of event. Fortunately, those events are useful and are instructions retired, core clock ticks and reference clock ticks. Any difference between the two clock tick counter-values can be accounted for by any speed scaling or turbo boost applied to the current CPU. For example, the CPUs in my laptop scale down and count at 800 MHz most of the time, while the reference counter counts at 2.7 GHz. This neatly gets around the problem of the invariant time-stamp counter present in latter-generation CPUs which can confuse people using RDTSC to create timing loops.
The following information describes the fixed-function counters:
| Register | MSR Name | Description |
|---|---|---|
0x309 |
IA32_FIXED_CTR0 |
Fixed-Function Performance Counter 0 (R/W): Counts INSTR_RETIRED.ANY. |
0x30A |
IA32_FIXED_CTR1 |
Fixed-Function Performance Counter 1 0 (R/W): Counts CPU_CLK_UNHALTED.CORE. |
0x30B |
IA32_FIXED_CTR2 |
Fixed-Function Performance Counter 0 0 (R/W): Counts CPU_CLK_UNHALTED.REF. |
So… how do you configure the general-purpose counters?
I’m glad you asked me that. For each of the general-purpose registers there is an associated “performance event select” register which you can program. The value in the control register determines what gets counted by the GP register. You can of course write to the GP register, but typically you only bother doing that when you want to reset its value to zero.
To program one of these perf-event selector registers, the process is effectively as follows:
Select which register to configure
“IA32_PERFEVTSELx MSRs start at address 186H and occupy a contiguous block of MSR address space.” In other words, if I wanted to configure IA32_PERFEVTSEL1, I would store the value 0x187 in the ECX register prior to calling WRMSR. This is the midly confusing part of the Intel documentation - while the peroformance events are enumerated in the tables in Section 18, the MSRs are in a completely separate volume (3C) in chapter 35! In the manuals I have, I need to look in table 35-2 to find the MSR identifier.
Determine the type of event you would like to count
This is where it gets a bit tricky…
Let’s work through an example, since I think that describing this in the abstract might take far longer and be far less clear. Let’s configure a register to count the number of µops issued by the instruction decoder.
In Intel’s Software Developer Manual Volume 3B, Chapter 19, the performance monitoring events are set out in tabular format. To count the µops issued, we need to find the relevant performance event, and after some searching in section 19.4 (2nd Gen Core-i7, remember), we would eventually find the following:
| Event Num | UMask value | Event Mask Mnemonic | Description |
|---|---|---|---|
0EH |
01H |
UOPS_ISSUED.ANY |
Increments each cycle the # of Uops issued by the RAT to RS. Set Cmask = 1, Inv = 1, Any = 1 to count stalled cycles of this core. |
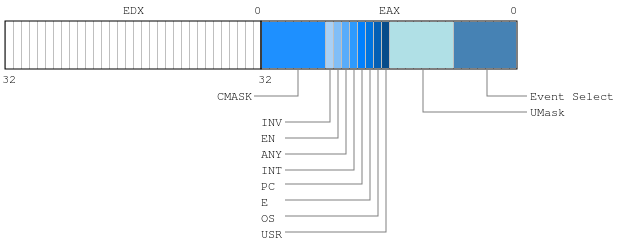
OK, this tells us that in order to count the event UOPS_ISSUED.ANY, we need to write 0x0E to the “Event Select” byte and 0x01 to the “UMask” byte of the relevant IA32_PERFEVTSELx MSR. Since they’re both 8-bits wide, it’s trivial to represent that as a hex-value: 0x010E. So far so good. But what about the other fields and flags? In the diagram above, there are several different flags which can be toggled to filter which events are counted or even to count state transitions. I won’t describe them all, but for the time-being will just set the EN and USR flags to enable the counter and set it to count µ-ops issued in user-land. Since I don’t want to count stalled cycled (see the “Description”), I will leave CMASK set to zero. Therefore, the value I need to store in the EAX register prior to issuing the WRMSR instruction is 0x0001010E.
Conceptually, writing to an MSR can be considered analagous to writing to a port number on a network stack: you’re send some listening application some data. It’s the same idea of logical identifiers. I suppose you write the operation of the WRMSR as follows:
msr[ecx] = eax + ((long long)edx << 32)The assembler to make this magic happen is as follows:
    mov $0x0041010E, %eax                # Write selector value to EAX
    xor %edx, %edx                       # Zero EDX
    mov $0x187, %ecx                     # Write logical register id to ECX (IA32_PERFEVTSEL1)
    wrmsr
Assuming you executed this code with ring-0 privileges (i.e. as the kernel) you should now be merrily accumulating in IA32_PMC1 a count of the µops issued. So how does one read this value? Well, that code is equally trivial:
    mov $0xc2, %ecx                      # Address of MSR IA32_PMC1
    rdmsr                                # Read value into EAX:EDX (EAX contains low-order bytes)
Again, the RDMSR instruction needs to be executed with ring-0 privileges — and for that reason, I put together the kernel module I discussed in the previous post. In the spirit of keeping things short and sweet, that’s where I’ll leave this post. Next time, with this background out of the way, I’ll show the code which records performance data using the kernel module.